The goal of my project is to write a RDF to GPML converter. To achieve this goal I had to learn about RDF and SPARQL. The next step was to know how GPML was build and how to write GPML using Java. To do this I am using eclipse to write my Java code.
To write GPML I will be using the pathvisio library. This library contains the necessary modules to write GPML. Here is a link to the tutorial on how to put the Jar files on eclipse: http://developers.pathvisio.org/wiki/PluginEclipseSetup
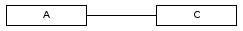
Now that the required packages are set I can start making my own GPML example pathway. As an example my task was to make the following:

Each square block is called a "Data Node" and each line has its own "MIM shape". The letters in the data nodes are the names of the genes/metabolites that the data nodes represent. The numbers on the right corner of each data node is the number of reference and the number given to the reference based on order inserted. Aside from the stuff that can be seen, background information like, detailed information of the reference, unique ids of the data nodes and lines and annotation have to be also included.
In the bellow Gist Github embeded link is the code to make this example shown. I will briefly go step by step through the code and explain it.
Before I start explaining the code, I would like to thank Martina Kutmon, who helped me with the start up of the code and on places where I got stuck and couldn't find out how to define or call certain stuff.
So lets start by making a separate class and call it WriteExampleGPML. Now I can start writing the code to create the GPML format for the example shown in the first figure. Before defining certain aspects of the pathway, I needed to create the pathway model:
// create pathway model
Pathway pathway = new Pathway();
Now that I have created the pathway model, I can start insert the certain elements that it requires. So first I will create all the data nodes (3x) and lines (2x) represented in the example. This can ve done using the following code:
// create data nodes
PathwayElement e1 = PathwayElement.createPathwayElement(ObjectType.DATANODE);
PathwayElement e2 = PathwayElement.createPathwayElement(ObjectType.DATANODE);
PathwayElement e3 = PathwayElement.createPathwayElement(ObjectType.DATANODE);
// create lines
PathwayElement l1 = PathwayElement.createPathwayElement(ObjectType.LINE);
PathwayElement l2 = PathwayElement.createPathwayElement(ObjectType.LINE);
In eclipse, when you forget to implement a certain module, will ask you to implemented, when it is being used. For this it has to be available. If I would have done the tutorial mentioned above wrong, I would not have access it.
Now that I have the basic figures I can start adding the attributes to each of them. For the data nodes different attributes are required than the lines. For the data nodes I added the following attributes: the data node coordinates, size, the name, ID, type and data node graph ID (which identifies the data node from other data nodes):
// adding attributes for data nodes
e1.setMCenterX(100); # x-coordinate
e1.setMCenterY(200); # y-coordinate
e1.setMWidth(80); # size of the box
e1.setMHeight(20); # size of the box
e1.setTextLabel("A"); # gene product name
e1.setElementID("1"); # gene product name
e1.setDataNodeType("Metabolite"); # type of the data node
pathway.add(e1); # add to pathway model
e1.setGeneratedGraphId(); # graph id (has to be set after its been added to the model).
As for the lines I added the attributes: The line coordinates, where it connects to, line thickness and line type. As well for the lines as data nodes, extra information can be added, like color etc., if required. But I will now just focus on these attributes. Make sure that MIMShapes is registered, or else it will not be recognized:
// register mimshapes
MIMShapes.registerShapes();
// adding attributes for lines
l1.setMStartX(140); # x-coordinate of the start of the arrow
l1.setMStartY(200); # y-coordinate of the start of the arrow
l1.setMEndX(260); # x-coordinate of the end of the arrow
l1.setMEndY(200); # x-coordinate of the end of the arrow
l1.setStartGraphRef(e1.getGraphId()); # link the line to the data node it binds to (tail)
l1.setEndGraphRef(e3.getGraphId()); # link the line to the data node it binds to (head)
l1.setLineThickness(1); # Thickness of the line
l1.setEndLineType(LineType.fromName("mim-conversion")); #The type of the line
Now that the main attributes has been set we can add extra ones that are required. As seen in figure one above the data node B links to the middle of the line between A and C. This line is linked to an anchor of the line between A and C. To create an anchor I did the following:
// create Anchor
MAnchor anchor = l1.addMAnchor(0.5); # puts anchor in the middle of line l1
anchor.setGraphId(pathway.getUniqueGraphId()); # create unique id for the anchor
Another point is that when we linked the lines to the data nodes, it binds to the data node in the middle of the box instead of on it sides, which will head the arrow head:
MPoint startl1 = l1.getMStart(); # start of the tail of the line
MPoint endl1 = l1.getMEnd(); # end of the head of the line
startl1.linkTo(e1,1.0,0.0); # bind the tail to a point on the side of the data node
endl1.linkTo(e3,-1.0,0.0); # bind the head to a point on the side of the data node
pathway.add(l1); # add the line
Now that we have the basic structure of the example, I will add the references to them. first we create the ids for each reference in each data node:
// add publications
e1.addBiopaxRef("id1");
e1.addBiopaxRef("id4");
e2.addBiopaxRef("id1");
e3.addBiopaxRef("id2");
e3.addBiopaxRef("id3");
Now that this is done I can add the annotation for each reference, Fist we need to get the Biopax reference manager and the PublicationXref model and then adding the information of the references:
# createing the Biopax and PublicationXref model
BiopaxElement refMgr = pathway.getBiopax();
PublicationXref xref = new PublicationXref();
# adding the reference information
xref.setPubmedId("1234");
xref.setTitle("Title");
xref.setYear("2013");
xref.setSource("Some source");
xref.setAuthors("Me");
# here we link the reference to the data node with the Id we created previously
xref.setId(e1.getBiopaxRefs().get(0));
refMgr.addElement(xref); # adding the data to the pathway model
Now that I have added all the information for my task in the pathway model I can write it to the GPML model using the following code:
// write to GPML
pathway.writeToXml(new File("/home/cizaralmalak/Desktop/test.gpml"), true);
Before I start explaining the code, I would like to thank Martina Kutmon, who helped me with the start up of the code and on places where I got stuck and couldn't find out how to define or call certain stuff.
So lets start by making a separate class and call it WriteExampleGPML. Now I can start writing the code to create the GPML format for the example shown in the first figure. Before defining certain aspects of the pathway, I needed to create the pathway model:
// create pathway model
Pathway pathway = new Pathway();
Now that I have created the pathway model, I can start insert the certain elements that it requires. So first I will create all the data nodes (3x) and lines (2x) represented in the example. This can ve done using the following code:
// create data nodes
PathwayElement e1 = PathwayElement.createPathwayElement(ObjectType.DATANODE);
PathwayElement e2 = PathwayElement.createPathwayElement(ObjectType.DATANODE);
PathwayElement e3 = PathwayElement.createPathwayElement(ObjectType.DATANODE);
// create lines
PathwayElement l1 = PathwayElement.createPathwayElement(ObjectType.LINE);
PathwayElement l2 = PathwayElement.createPathwayElement(ObjectType.LINE);
In eclipse, when you forget to implement a certain module, will ask you to implemented, when it is being used. For this it has to be available. If I would have done the tutorial mentioned above wrong, I would not have access it.
Now that I have the basic figures I can start adding the attributes to each of them. For the data nodes different attributes are required than the lines. For the data nodes I added the following attributes: the data node coordinates, size, the name, ID, type and data node graph ID (which identifies the data node from other data nodes):
// adding attributes for data nodes
e1.setMCenterX(100); # x-coordinate
e1.setMCenterY(200); # y-coordinate
e1.setMWidth(80); # size of the box
e1.setMHeight(20); # size of the box
e1.setTextLabel("A"); # gene product name
e1.setElementID("1"); # gene product name
e1.setDataNodeType("Metabolite"); # type of the data node
pathway.add(e1); # add to pathway model
e1.setGeneratedGraphId(); # graph id (has to be set after its been added to the model).
As for the lines I added the attributes: The line coordinates, where it connects to, line thickness and line type. As well for the lines as data nodes, extra information can be added, like color etc., if required. But I will now just focus on these attributes. Make sure that MIMShapes is registered, or else it will not be recognized:
// register mimshapes
MIMShapes.registerShapes();
// adding attributes for lines
l1.setMStartX(140); # x-coordinate of the start of the arrow
l1.setMStartY(200); # y-coordinate of the start of the arrow
l1.setMEndX(260); # x-coordinate of the end of the arrow
l1.setMEndY(200); # x-coordinate of the end of the arrow
l1.setStartGraphRef(e1.getGraphId()); # link the line to the data node it binds to (tail)
l1.setEndGraphRef(e3.getGraphId()); # link the line to the data node it binds to (head)
l1.setLineThickness(1); # Thickness of the line
l1.setEndLineType(LineType.fromName("mim-conversion")); #The type of the line
Now that the main attributes has been set we can add extra ones that are required. As seen in figure one above the data node B links to the middle of the line between A and C. This line is linked to an anchor of the line between A and C. To create an anchor I did the following:
// create Anchor
MAnchor anchor = l1.addMAnchor(0.5); # puts anchor in the middle of line l1
anchor.setGraphId(pathway.getUniqueGraphId()); # create unique id for the anchor
Another point is that when we linked the lines to the data nodes, it binds to the data node in the middle of the box instead of on it sides, which will head the arrow head:
To correct this I need to define the MPoint bindings on the data nodes:
MPoint endl1 = l1.getMEnd(); # end of the head of the line
startl1.linkTo(e1,1.0,0.0); # bind the tail to a point on the side of the data node
endl1.linkTo(e3,-1.0,0.0); # bind the head to a point on the side of the data node
pathway.add(l1); # add the line
Now that we have the basic structure of the example, I will add the references to them. first we create the ids for each reference in each data node:
// add publications
e1.addBiopaxRef("id1");
e1.addBiopaxRef("id4");
e2.addBiopaxRef("id1");
e3.addBiopaxRef("id2");
e3.addBiopaxRef("id3");
Now that this is done I can add the annotation for each reference, Fist we need to get the Biopax reference manager and the PublicationXref model and then adding the information of the references:
# createing the Biopax and PublicationXref model
BiopaxElement refMgr = pathway.getBiopax();
PublicationXref xref = new PublicationXref();
# adding the reference information
xref.setPubmedId("1234");
xref.setTitle("Title");
xref.setYear("2013");
xref.setSource("Some source");
xref.setAuthors("Me");
# here we link the reference to the data node with the Id we created previously
xref.setId(e1.getBiopaxRefs().get(0));
refMgr.addElement(xref); # adding the data to the pathway model
Now that I have added all the information for my task in the pathway model I can write it to the GPML model using the following code:
// write to GPML
pathway.writeToXml(new File("/home/cizaralmalak/Desktop/test.gpml"), true);